HTLB Track Record
Documented investor studies, public ledgers, research notes, risk metrics and track-record comparisons across six years of public research legacy.
Investor & HTLB Track Record Comparison
Compare performance, risk metrics and research insights using HTLB's analytical framework.
Counters
- ESCORTS
- RPEL
- WABAG
- WOCKPHARMA
- JUBLPHARMA
- FORTIS
- KARURVYSYA
- FEDERALBNK
- CANBK
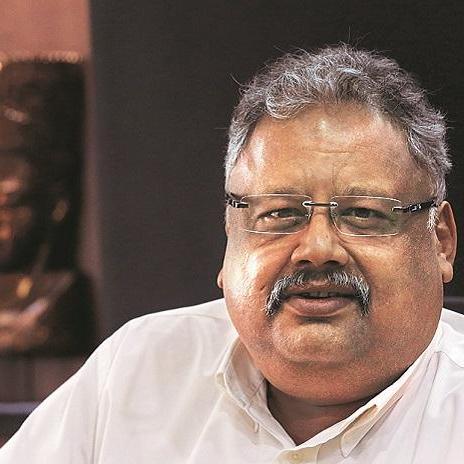
"Invest in businesses, not just stocks."
— Rakesh Jhunjhunwala
Rakesh Jhunjhunwala
Long-Term Wealth CreatorAnnual ROI Comparison
Illustrative zero-to-rate comparison · not historical performance.
- Investor Annual ROI:99.43%
- HTLB Annual ROI:224.55%
- HTLB Prime ROI:669.85%
Maximum Drawdown Comparison
- HTLB MaxDD:1%
- Investor MaxDD:30.02%
Top Holdings
- 1ESCORTS
- 2RPEL
- 3WABAG
- 4WOCKPHARMA
- 5JUBLPHARMA
6-Year Public Ledger Archive
Yearly research archives with documented studies, public ledgers and risk analysis based on public data.
- Investor Studies
- 18
- Public Ledgers
- 42
- Risk Review
- Completed
- Investor Studies
- 26
- Public Ledgers
- 76
- Risk Review
- Completed
- Investor Studies
- 35
- Public Ledgers
- 95
- Risk Review
- Completed
- Investor Studies
- 48
- Public Ledgers
- 128
- Risk Review
- Completed
- Investor Studies
- 65
- Public Ledgers
- 180
- Risk Review
- Completed
- Investor Studies
- 72
- Public Ledgers
- 210
- Risk Review
- In Progress
How HTLB Documents Track Record
Public Portfolio Study
We analyse publicly available portfolio data, holding changes and investment history.
Business & Sector Mapping
We study the businesses, sector exposure and themes behind each investment.
5-Year Curve & Risk Review
We track 5-year performance, compare with benchmarks and analyse risk.
HTLB Framework Comparison
We evaluate investments using HTLB's timeless principles and framework.
Video Case Study
We create in-depth video case studies to explain insights and takeaways.
Featured Investor Studies
HTLB Systems · Research Data
Institutional Investment Comparison Lab
Explore historical investor investment data and HTLB Systems performance comparisons across individual securities.
All Investors
Total Counters 129
- Investor Investment Time Avg
- 6.62Yrs
- HTLB Investment Time Avg
- 1.11Yrs
- Investor Annual ROI Avg
- 125.36%
- HTLB Annual ROI Avg
- 392.41%
- HTLB Prime ROI Avg
- 831.18%
- Investor MaxDD Avg
- 30.49%
Unweighted arithmetic means · 129 individual records · All investors
Historical dataset comparison
- Investor125.36%
- HTLB392.41%
- HTLB Prime831.18%
Historical dataset comparison
- Investor6.62 Yrs
- HTLB1.11 Yrs
Historical dataset comparison
- Investor MaxDD30.49%
- HTLB Max DD1.05%
Original Investment Records
129 matching counters of 129 records
| HIGHENE | Balram Bharwani | 7th Dec 2015 | 10.64 | 2.5 | 179 | 496.8 | 854 | 19.6 | 2.92% | 1242 | 1 |
| GENUSPOWER | Ajay Upadhyaya | 7th Dec 2017 | 9 | 0.16 | 33.17 | 792.5 | 792.5 | 79.75 | 1.54% | 126.8 | 1 |
| LAURUSLABS | Akash Bhanshali | 5th Mar 2019 | 7.48 | 2 | 352.31 | 410.5 | 1058.06 | 16.54 | 1.52% | 821 | 1 |
| GEECEE | Akash Bhanshali | 3rd Sep 2018 | 8 | 1 | 19.17 | 176.66 | 431.42 | 67.06 | 4.57% | 176.66 | 1 |
| PAYTM | Akash Bhanshali | 10th Jun 2024 | 2.16 | 1 | 48.8 | 99.2 | 99.2 | 8.76 | 1.21% | 99.2 | 1 |
| ASAHIINDIA | Anuj Anintrai Sheth | 10th Dec 2015 | 10.72 | 2 | 76.36 | 240.27 | 310.47 | 13.15 | 2.47% | 480.55 | 6 |
| THEMISMED | Anuj Anintrai Sheth | 15th Dec 2015 | 10.72 | 1 | 19.01 | 166.7 | 526.8 | 45.88 | 2.94% | 166.7 | 1 |
| PALREDTEC | Ashish Dhawan | 9th Dec 2019 | 6.72 | 0.56 | 47.25 | 319.78 | 669.89 | 39.87 | 4.06% | 219.4 | 1 |
| RPSGVENT | Ashish Dhawan | 12th April 2019 | 7.5 | 0.32 | 9.44 | 310.62 | 310.62 | 79.96 | 3.09% | 99.4 | 1 |
| SHAILY | ASHISH KACHOLIA | 14th Dec 20215 | 10.8 | 1.24 | 259 | 860.48 | 1406.6 | 69.39 | 12.02% | 1067 | 1 |
| SJS | ASHISH KACHOLIA | 15th nov 2021 | 5 | 1 | 78.5 | 359 | 359 | 21.17 | 1.54% | 359 | 1 |
| GRAVITA | ASHISH KACHOLIA | 13th Jun 2022 | 4.24 | 1.32 | 137.72 | 291.43 | 328.17 | 15.06 | 1.67% | 384.7 | 1 |
| NIITLTD | ASHISH KACHOLIA | 4th Jun 2018 | 8.16 | 1.5 | 39.81 | 290.33 | 938.86 | 44.35 | 2.23% | 435.5 | 1 |
| TARC | ASHISH KACHOLIA | 6th Sep 2021 | 5 | 1 | 41.07 | 171.6 | 403.99 | 17.5 | 1.50% | 171.6 | 1 |
| SAFARI | ASHISH KACHOLIA | 24th Feb 2020 | 6.5 | 1.72 | 96.52 | 148.92 | 269.08 | 44.8 | 1.71% | 256.15 | 1 |
| PCBL | ASHISH KACHOLIA | 5th Sep 2022 | 4 | 1 | 33.07 | 103.4 | 267.9 | 19.37 | 1.54% | 103.4 | 1 |
| GRWRHITECH | ASHISH KACHOLIA | 15th Mar 2021 | 5.5 | 0.72 | 158 | 1020 | 310 | 28.08 | 1.43% | 733.8 | 1 |
| HLEGLAS | ASHISH KACHOLIA | 15th Jan 2020 | 6.72 | 0.24 | 40 | 601.66 | 601.66 | 36.7 | 1.69% | 144.4 | 1 |
| SKYGOLD | ASHISH KACHOLIA | 4th Dec 2023 | 2.64 | 0.4 | 250.27 | 1095.25 | 1262.7 | 23.22 | 3.09% | 438.1 | 1 |
| FCL | ASHISH KACHOLIA | 7th Feb 2022 | 4.5 | 0.24 | 40.87 | 905 | 782.9 | 15.65 | 1.84% | 217.2 | 1 |
| SCHNEIDER | Ashok Kumar Jain | 19th Mar 2018 | 8.4 | 1.16 | 136.25 | 682.75 | 452.18 | 49 | 1.52% | 792 | 1 |
| FLUIDOM | Ashok Kumar Jain | 7th Dec 2015 | 10.5 | 1 | 45.59 | 374.42 | 345.82 | 72.42 | 22.50% | 374.42 | 1 |
| MBAPL | Ashok Kumar Jain | 4th Dec 2023 | 3 | 1 | 60 | 119.3 | 119.3 | 27.25 | 1.08% | 119.3 | 1 |
| LELAVOIR | Ashok Kumar Jain | 8th Mar 2020 | 6.32 | 1 | 58.04 | 94.5 | 877.82 | 27.29 | 4.37% | 94.5 | 1 |
| CEEJAY | Ashok Kumar Jain | 9th Oct 2023 | 3 | 1 | 1.07 | 72.25 | 116.36 | 14.28 | 1.59% | 72.25 | 1 |
Showing 1–25 of 129 records
Source data notes
The supplied sheet contains 132 records. Nikhil Vora’s three records are excluded as requested, leaving 129. Original spellings, capitalization, repeated FILTRA entries, dates “14th Dec 20215” (SHAILY and ESCORTS), and stakes without a percentage sign (KRPT: 1.33; ANSALBU: 1.19) remain unchanged. The untouched original is retained separately.
Historical investment and HTLB Systems comparison data is presented for research and educational purposes only. Historical performance does not guarantee future results. This information does not constitute investment advice or a buy/sell recommendation.

Evidence. Discipline. Long-Term Learning.
Explore our complete research archive, performance records and case studies built over 6+ years.
A brighter
tomorrow.